|
Financial Professionals Spring 2026
This is my quarterly e-mail (affectionately referred to by some as the “massive missive”), intended primarily for my fellow financial professionals. It’s simply a way to share things of possible interest that I have read or thought about this quarter. Enjoy!
First, as noted in A New Year’s letter to a young person, take the messy job. Some points from the conclusion:
- “[B]uild deep, substantive knowledge in your field.”
- “[O]penness to new experiences, and the ability to learn new things quickly, will become even more important than it already is. Choose the job where you will learn most, but also the one where you will learn to learn. You will have to reinvent yourself throughout your life. New jobs will appear that we have not even imagined. If knowledge is the largest constraint that we face, then cheap knowledge will change everything, from medicine or the law to every field of research. The specific knowledge you learn today will depreciate faster than ever. What matters is the slope of your learning curve and your ability to adapt.”
- “[S]eek leverage. In the past, your output was limited by your time – a chef can only cook for so many people… The constraint is no longer your production capacity; it is your ability to direct the machine.”
Also, get lucky.
Second, interesting point here: “Every single nine is a constant amount of work. Every single nine is the same amount of work. When you get a demo and something works 90% of the time, that’s just the first nine.” (Nines)
Said another way, in many (probably most) domains, approaching perfection is usually an asymptote where additional progress takes increasing amounts of effort/time/cost. Progress is not linear.
Third, some private equity links: one, two, three, four, five, six (alternate link). Also, as you may have heard, private equity is coming hard for retail investors (link). I have a few comments on that last paper (which is excellent). They write (citations omitted):
In the United States, interval funds, tender offer funds, non-traded business development companies (BDCs), and non-traded REITs are the main retail vehicles for private equity and private credit. Industry estimates place assets in these semi-liquid structures at roughly $350 billion at the end of 2024, up from about $215 billion at the end of 2022 (around 60 percent total growth over two years). The largest retail-facing private credit funds are managed by a relatively small set of sponsors (for example Blackstone, Cliffwater, Blue Owl, Apollo), although concentration varies by segment and changes over time.
The listed market (U.S.) is roughly $69 trillion (source), so $350 billion is roughly half a percent of that. Thus, if you have $10 million dollars in U.S. stocks you should have roughly $50k in listed alts (adjust up or down from that for the amount you want to overweight or underweight, but that should be your baseline – and you should own all of them proportionally). Perhaps slightly higher if the vehicle doesn’t own 100% of the underlying investment. For example, suppose the portfolio investments of the semi-liquid structures are only half of the total – the other half of the underlying real estate, PE, etc. are held by other types of structures, or individuals directly – then you could double the percentage. Owning all the semi-liquid investments is like owning an alt index fund that is float adjusted. Increasing as I just mentioned removes the float adjustment and would be equivalent to a straight cap-weight.
These retail-oriented funds offer mandatory quarterly redemptions, normally up to five percent of net asset value (NAV).
I have repeatedly heard speakers at alternatives conferences, etc. say that you can get all of your money out in five years. This is absolutely not true. (They are not intentionally lying, just innumerate.) The 5% is computed on the new value, so you get the last dollar out roughly … <checks notes> … never. Each quarter you get 5% so you have 95% still invested. After 5 years (20 quarters) you could still have 0.95^(5*4) = 35.8% of the shares you originally bought trapped there. (Shares, not dollars, because prices of the shares will change over time.)
An important issue left out of the paper is how stale/smoothed NAVs mechanically lower both the reported standard deviations and correlations to other investments. These inaccurate numbers make alts look attractive, but it’s superficial – more proverbial lipstick on a pig. Recently (here) Craig Callahan and C. Thomas Howard demonstrated that when using traded alternative fund options (see table 1) – which have real pricing, rather than smoothed/stale/inflated pricing – alts get essentially no allocation in a MPT-optimized portfolio.
Fourth, a decomposition of expected stock returns in bullish times here. A key quote from that: “[N]ote that if over the ten years after Jun/2025 earnings were to grow at their historical rate of 4.2%, and the P/E reverted to its historical average of 16.0 by Jun/2035, then the annual return over the Jun/2025-Jun/2035 period would be just 0.4%.”
See also this, but note that just because the metric has changed over time doesn’t mean it’s useless. I agree with Manu that today’s measurement of earnings is better, so we can compare that to bonds – specifically TIPS, since earnings should be real, not nominal.
As I write this, the S&P 500 PE is 24.45 (source) so the earnings yield (the inverse) is 4.09%. Ten-year TIPS are 1.92% (source). So, by this metric the ERP is 2.13%.
NB:
- If I used longer-term TIPS then the ERP would be even lower.
- This is just looking at the S&P 500 – other equity investments (e.g., foreign, small cap, value) look much more favorably priced.
- Aswath Damodaran estimates an ERP of over 4% (source).
Fifth, a less-thought-about crypto risk here (alternative link).
Sixth, structured products are just Wall Street’s Expensive Candy.
Seventh, another reason to do everything electronically; postmarks can no longer be relied on to indicate when you mailed something (link). In addition to filing/paying electronically, you can also use other options (and this has always been a best practice): “Certified Mail Return Receipt Requested and Certificate of Mailing are the most thorough options available because these services document both proof of mailing to and confirmation of receipt by the taxing authority.” (source)
Eighth, a blogger (who I respect) recently wrote: “If you’re worried about housing as an investment, you might put down 5-10% instead of 15-20%.” He generally has good stuff (he’s a CFA), but this was wrong. (He originally wrote that it reduces your real estate exposure, but he modified the post after I emailed him about it, so I’m not giving his name.) The amount of equity in a home has nothing to do with real estate exposure – unless the loan is non-recourse. The individual has 100% exposure to real estate, plus a short bond position (the mortgage). If the mortgage is non-recourse (which is very rare), then the clearest way to model that situation is that they also have a put option on the home with a strike price at the value of the debt.
This misconception is pretty common (it’s actually one of the nine “Financial Planning Urban Legends” that I covered at some NAPFA regional meetings last year); if it were true that less equity meant less risk, then analogously a margin loan on a stock portfolio would mean less exposure to stocks!
Ninth, similar to what I sent out last quarter (here) about the return on the classic car, there was an article (here) about the Superman #1 comic which sold for $0.10 in 1938 and $15 million today. What CAGR do you think that is?
($15,000,000/$0.1)^(1/88)-1=24%
Tenth, a nice, balanced, analysis on bitcoin here. (Seriously, I'm not being sarcastic.)
Eleventh, some general advice: read, and try everything twice.
Twelfth, paper on the impact of SES (Socio-Economic Status) on longevity here.
Men:
Women:
“When we assess the marginal contribution of each indicator, wealth stands out as the single most informative factor; excluding wealth from the multi-factor model causes the largest drop in the measured inequality.”
So our clients are pretty likely to have longer lives.
Thirteenth, I have no idea what gold prices are going to do. The return in 2025 was 65%. The only higher year (since coming off the gold standard) was 132% in 1979. The return on gold (nominal!) was a CAGR of negative 10% over the next decade (i.e., it lost 23.5% cumulatively over the 1980s in nominal dollars, and 53.5% in real dollars).
(Raw gold return data source here.)
The CAGR of gold from 1979-2025 (inclusive) was 6.5%. If you start one year later and end one year earlier (i.e., eliminate 1979 and 2025) it’s 3.6% – those two years account for a huge amount of the total returns. (Nominal, and CPI was 3.4% and 3.2% respectively. TIPS are currently priced to yield about 2.5% real on long durations. The volatility of gold is higher than stocks over this period, and the Sharpe ratio is 0.35.)
It’s also interesting that the 2025 return on “digital gold” (Bitcoin) was -6.3%. (source)
Bloomberg noted, Gold Is Behaving More Like a Meme Stock These Days (alternative link).
Fourteenth, according to a recent paper, The Optimal Long-term Portfolio Share of Bitcoin is Negative (or Zero). Abstract:
Applying the standard Markovitz mean-variance framework to a two asset portfolio consisting of US stocks (S&P500) and Bitcoin (BTC), challenges the notion that BTC offers diversification benefits for long-term investors. With risk (variance and covariance) estimated using data from 02/14 to 02/25 and long-term returns based on standard efficient markets assumptions, the optimal portfolio share for Bitcoin -1.6% (full sample) and -7.3% (recent sample), regardless of investor preferences towards risk. Other contributions on BTC in portfolio management report that a positive BTC portfolio share improves risk-return trade-offs. This difference is explained by their focus on short-term dynamic asset allocation strategies and the more recent data used here, exhibiting an increased positive correlation between BTC and stock returns. This suggests that BTC is only of interest for speculation and long-term returns to the crypto industry only from the facilitation of this gambling.
I pulled monthly return data from Morningstar and did a correlation matrix and looked at the standard deviations for various time horizons (Bitcoin data only went back eleven years):
11 Years |
Fidelity Bitcoin TR USD |
NASDAQ 100 TR USD |
S&P 500 TR USD |
Fidelity Bitcoin TR USD |
100% |
33% |
35% |
NASDAQ 100 TR USD |
33% |
100% |
92% |
S&P 500 TR USD |
35% |
92% |
100% |
|
|
|
|
Sigma |
73% |
18% |
15% |
|
|
|
|
5 Years |
Fidelity Bitcoin TR USD |
NASDAQ 100 TR USD |
S&P 500 TR USD |
Fidelity Bitcoin TR USD |
100% |
50% |
51% |
NASDAQ 100 TR USD |
50% |
100% |
92% |
S&P 500 TR USD |
51% |
92% |
100% |
|
|
|
|
Sigma |
62% |
19% |
15% |
|
|
|
|
3 Years |
Fidelity Bitcoin TR USD |
NASDAQ 100 TR USD |
S&P 500 TR USD |
Fidelity Bitcoin TR USD |
100% |
45% |
48% |
NASDAQ 100 TR USD |
45% |
100% |
88% |
S&P 500 TR USD |
48% |
88% |
100% |
|
|
|
|
Sigma |
53% |
16% |
12% |
I was expecting a much higher correlation to the NASDAQ 100 (i.e., QQQ) than to the S&P 500 but the opposite is true (though they are very close). So now I will ignore the NASDAQ 100.
Roughly speaking, Bitcoin is 50% correlated to the S&P 500 and over three times as volatile.
I’m going to use the following figures: Sigma of 15% for stocks and 45% for Bitcoin (I’m favoring Bitcoin a little, but it does look like the volatility may be decreasing) and 50% correlation between the two.
The standard deviation of a portfolio of the two is given (as I’m sure you remember from the CFP exam if you have taken it) by: (w12σ12 + w22σ22 + 2w1w2Cov1,2)½
The portfolio return is given by simply taking the weighted average of the returns.
I want to know what weight of Bitcoin and stocks maximizes the Sharpe ratio. But I don’t have any way whatsoever to estimate an expected return on Bitcoin. So, I’m going to do this backward. What return on Bitcoin would be required to have even a 1% weighting? I’m going to assume a 10% arithmetic stock return. In other words, at a 1% weight, what Bitcoin alpha over stocks gives us a better Sharpe over just holding 100% stocks?
The alpha over stocks has to be greater than 5.34% to justify an allocation at the 1% level. Frankly, that’s lower than I was expecting.
To me a 1% weight though is so small it isn’t worth the hassle. What is the breakeven alpha to justify a 5% weight? 6.64%
I’ve been using 10% arithmetic return for stocks. The alpha gets smaller as the stock return gets smaller though. Bitcoin is a partial hedge (because it’s only 50% correlated). Suppose the expected return on stocks was just 5% (arithmetic)?
Then you would need alphas of 2.67% for a 1% weight, and 3.32% for a 5% weight to breakeven on Sharpe.
I don’t believe there is any reason to expect positive alpha (in fact, I expect a large negative one), so I wouldn’t buy any, but it’s not as outlandish as I thought it would be.
Let me take this out of the Sharpe ratio realm and get to geometric returns to see if they are meaningfully higher. Suppose the arithmetic return on stocks is expected to be 10%; at a 15% standard deviation, that means the geometric return is expected to be 8.88% (you approximate this by subtracting half the variance). Assume an expected Bitcoin alpha of 10% over stocks (that translates into just 1% higher geometric because of the volatility, again you subtract half the variance, and the variance is the standard deviation squared). A 1% weight gives you 9 bps higher portfolio return, and a 5% weight gives you 42 bps.
Fifteenth, a very academic overview of the various theories of bubbles here.
Sixteenth, the book Thinking in Bets has been on my reading list for a while, but I just got around to it, and I highly recommend it. In fact, I’ve added it to the recommended reading list at the end of Ruminations on Being a Financial Professional.
There was a similar article in a NYT Magazine recently on behavioral finance and golf (instead of poker) here.
Seventeenth, a few good quotes:
“[M]ost modern people don’t chase wealth. They chase the appearance of wealth. As long as other people think they are rich, they’ve accomplished their goal.” – Darius Foroux (source)
“Stability breeds instability. The more stable things become, and the longer things are stable, the more unstable they will be when the crisis hits.” – Hyman Minsky
“Almost everything will work again if you unplug it for a few minutes, including you.” – Anne Lamott
“I can think of many cases in which I would recommend active money managers over index funds. I might be giving the advice to someone I hate.” – Scott Adams, creator of Dilbert
Eighteenth, I’ve written about this before, but here is a good discussion of the relationship between happiness and money.
Nineteenth, a follow-up to a paper I noted last year (here) is Stocks for the Long Run Revisited: Dividends and “The Return Nobody Got”.
Twentieth, while you should trust a literature, not a paper (see here), this paper (link) is interesting. From the conclusions at the end:
- empirical evidence is more informative than theoretical evidence for post-sample prediction
- investors do not learn about risk from academic research
- data mining is effective
- mispricing is the primary driver
I don’t necessarily like all of these conclusions (I prefer my empirical finding to have some theoretical justification), but it is interesting.
Twenty-First, an excellent paper on market efficiency came out (link). Virtually every page has little-known content that I have taught and explained for years – it’s annoying to have it down in one paper published by someone else! I have also used the paradigm in his title on many occasions, explaining, that you should realize that when you trade, the other side of that trade is much more likely to be Goldman Sachs than it is your idiot brother-in-law. That should slow you down considerably.
Nonetheless, I, of course, have comments:
- On page 3 he says that markets must be inefficient enough to pay for the research and cites “professors of finance and … a winner of the Nobel Prize” in support. I don’t mind disagreeing with them all. They are correct if people are rational and/or skill can be clearly discerned. Pretending to do research, or doing more than can possibly help, can permit charging fees higher than alpha so long as the clients (the portfolio manager’s investors) can’t tell the money is wasted. Thus, pace all the luminaries, the market could be less inefficient than the research costs. As I wrote a few years ago: “Returns flow to the scarce factor of production: capital (money) is abundant, while the ability to generate alpha is scarce. Thus, excess returns are extracted entirely by the managers. Frequently they extract even the apparent (not actual) ability to generate alpha.” Meaning that managers can frequently extract more than the alpha, and markets do not have to be inefficient enough to pay for the research, because the research isn’t for results, it’s for the illusion of results. (This can happen within an investment vehicle too. If you work for a fund as one of many analysts, you may well spend more on research – such as site visits – than you expect to be returned in brilliant insights simply because “looking busy” keeps you employed, even if the money is essentially wasted.)
- From page 4: “[A] retail investor paid 2.5 percent of the purchase price to buy 100 shares of a $25 stock before the deregulation of commissions on May 1st, 1975. Such a purchase today would be effectively free of commission.” I don’t think people realize how expensive it used to be. The implication of this is the expected returns on stocks are, ceteris paribus, lower (2.5% times your assumed annual turnover rate including dividend reinvestment) than the historical data seems to indicate (since that historical index data doesn’t generally reflect any costs).
- The book The Wisdom of Crowds is very good, but really, you only need to know the three preconditions for that wisdom, which he gives. (Page 5)
- I refer to the Samuelson Dictum (page 6) relatively frequently, though usually orally to clients, I don’t seem to have written it much. But I did share this in 2013, and the full quote (not given by Mauboussin) is worth reading, perhaps especially now:
[F]rom legendary economist Paul Samuelson (1998):
The pre-1800 pattern of commercial panics had to be a case of NON MACRO-EFFICIENCY of markets. We’ve come a long way, baby, in two hundred years toward micro efficiency of markets: Black-Scholes option pricing, indexing of portfolio diversification, and so forth. But there is no persuasive evidence, either from economic history or avant garde theorizing, that MACRO MARKET INEFFICIENCY is trending toward extinction: The future can well witness the oldest business cycle mechanism, the South Sea Bubble, and that kind of thing. We have no theory of the putative duration of a bubble. It can always go as long again as it has already gone. You cannot make money on correcting macro inefficiencies in the price level of the stock market.
- I have also shared Black’s definition of efficiency occasionally (here, for example). (Page 6)
- I have also shared the Bessembinder findings with you previously (link). (Page 7)
- On page 10 he makes a similar point to my first one.
- From page 15: “Retail ownership was last at current levels at the end of 1999.” That would seem like an ominous augury, but if you look at the graph, it was just part of a very long-term trend.
- From page 16: “A great deal of retail activity today, especially in the equity options market, is veiled gambling.” Amen, brother – preach!
- He mentions Ed Thorpe on page 21. I recommend Fortune’s Formula which talks about the Kelly formula (I talked about it here) and Ed Thorpe taking it to Vegas. I also have another book on Thorpe to read, but haven’t gotten to it yet: A Man for All Markets: From Las Vegas to Wall Street, How I Beat the Dealer and the Market
- On page 25, I was very happy to see him get the definition of mean reversion right, as he did liquidity on page 19. These are two of my “Three Terms Used Incorrectly by Financial Professionals” (link) and he got them both right. (He also got positive feedback loop, in a positive direction, right on page 29, but everyone gets that right. It’s positive feedback loop in a negative direction – the third term at the link – that most everyone gets wrong.)
- He briefly mentions Phil Tetlock on page 33. If you want more, see The Signal and the Noise by Nate Silver, Expert Political Judgement by Phil Tetlock, and The Fortune Sellers by William Sherden. (I have read all of those, I also own, but have not yet read, Superforecasting: The Art and Science of Prediction by Phil Tetlock as well.)
Twenty-Second, you may think this article, which notes that the median U.S. worker has $955 saved for retirement, is from The Onion or Babylon Bee, but it isn’t.
Twenty-Third, I read an article (here) which isn’t about financial advisors at all, but I think it makes an interesting point. The value-add in the future is how embedded you are in your client’s situation – i.e., how much tacit knowledge of them you have. Explicit knowledge is important, but not differentiating.
Also, see this, which is why, despite periodic panic that roboadvisors or whatever are going to displace us, I’m not particularly worried. (Though I’m always paying attention, because Only the Paranoid Survive!)
But this is why we need to work with higher net worth individuals and provide higher quality, higher touch, service. The low end can, and will, be automated.
Twenty-Fourth, you may have seen that Google recently issued some 100-year bonds at 6.125% and it was almost 10x oversubscribed. (The following is from February, but I’m not going to take the trouble to update it here.)
A 30-year Treasury (issued 1/15/26) is currently trading at 96.842230 with a 4.625% coupon (link). The Macaulay duration on that is about 16 years (16.289 to be precise).
You run a pension fund (let’s say) so you want longer durations to hedge (immunize) your future obligations. Thus, this bond interests you.
What do you think (don’t calculate, just think) the duration of this bond is? I.e., how much does it help you?
I wrote a little duration calculator back in 2010 (Duration Calculator for Stocks, Bonds, & Mortgages). Using that, for the 30-Year Treasury:
Term (years): |
30 |
Bond Rate: |
4.625% |
Current Rates: |
4.825% |
Current Price: |
$968 |
Macaulay Duration (years): |
16.29 |
Effective Duration (years): |
15.92 |
For the 100-Year Google Bond (which apparently sold at a slight premium, which I’ve incorporated here):
Term (years): |
100 |
Bond Rate: |
6.125% |
Current Rates: |
6.050% |
Current Price: |
$1,012 |
Macaulay Duration (years): |
16.98 |
Effective Duration (years): |
16.48 |
Difference of about 0.7 years, which is a little over 8 months.
Surprising, no? This is why shorting is important to getting long-duration bond portfolios (link).
Twenty-Fifth, there was an extended thread on the FPA message boards regarding firing a client and one contributor (Neal Solomon) had a great list of what to include in the termination letter. If you should find yourself in that position, his advice is helpful. Here is the relevant portion of his post:
There is an old Irish saying that goes something like this - “Diplomacy is the art of telling someone to go to hell, and having them thank you and ask for directions”.
When these circumstances with challenging clients come to the point that we need to tell them (not ask them) to leave, we ourselves experience emotions. After all, we are in the profession, and business, of helping people. When we conclude that we can’t do that, we might question why we failed. The key is to put that to the side and to execute on the termination decision - firmly but gracefully and diplomatically. We would hope that the ex-client would actually be inclined to thank us, or at least not to say bad things about us.
There are several elements that I like to include in such letters:
1. the fact that we are terminating the relationship, as of a specific stated date, and that following that date our responsibilities are concluded, must be clear. This sentence should be concise, and at the opening of the letter.
2. we want to cover our backsides from a compliance, legal, and in the event of any potential complaint, basis. So if the circumstances justify, we do include - briefly - that we have made many recommendations, and have offered advice, which has not been accepted and acted upon. I include a sentence that expresses both that perhaps the client may be more comfortable with, and more accepting of advice from some other professional - but also (and this further documents your concerns and professionalism) that you have ongoing concerns that if the client does not alter course, there seems a significant possibility that they may experience “adverse outcomes”. Tell them that you do not want to in any way be viewed as having responsibility for that. I say something to the effect of “Of course, the final decision to accept any of the advice that we have offered, is yours. That said, we would never want you to feel that we had any responsibility if your choices, especially when your decisions may differ significantly from what we have recommended, don't work out favorably for you. Your choices are your choices”.
3. Give them directions - and remove the need for them to come back to you. This means confirming in writing that they are receiving by mail or electronically all account statements, copies of all relevant documents, cost basis where applicable, that they have web access to custodians, and contact telephone numbers/addresses for all insurers, custodians, and the like. A section of the letter explains that you are confirming that they have, have access to, or otherwise know everything that they might need to move their business somewhere else - and not need your further assistance. Here is everything that you need, or a reminder that they already have everything they might need. If there were letters or documents recommending actionable items, that the client rebuffed or failed to follow up on - include copies of those as well.
4. Be extremely gracious. Thank them for past their business and support. Tell them that it has been a pleasure trying to assist them. Wish them all the best in their future.
Twenty-Sixth, there was a good post on withdrawal rates here. My quibble with the Bengen research (and that post) is that it assumes the past is a good guide to the future, that the historical rate of return is indicative of the expected rate of return.
I liked this line from it: “[T]he core idea of proper retirement planning really isn’t about spending so little that you essentially eliminate all risk. That’s the anxiety talking.”
Twenty-Seventh, how many financial advisors are there? FINRA says there are 644,290 Registered Representatives (source).
BLS says there are 326,000 Personal Financial Advisors (source) and 514,500 Securities, Commodities, and Financial Services Sales Agents (source), for a total of 830,500.
There are 107,558 (source) people with a CFP designation, but not all of those individuals would be financial advisors.
So, it seems that at most 1/3 of financial advisors hold the CFP designation (107,558/326,000) and possibly many fewer. My best guess would be 20-25%, but even that may be high.
The CFP board used to provide much better data, but they stopped many years ago for unknown reasons (for example, the number of CFPs who also held certain other designations, the number that were client-facing, etc.).
For what it’s worth, NAPFA has “more than 4,600 practitioners” (source) and there appear to be (source) fewer than 9,000 CIMAs (they have awarded 9,000 but it’s been around for a while, so not all would be active) and 4,000 CPWAs (as a newer designation, that should be a decent estimate). Many CIMAs are in institutional sales, but the CPWAs are almost certainly working with private clients.
Twenty-Eighth, full details on the new section 530A Trump accounts are here, but it appears they are usually inferior to other options such as 529s, 2503(c) trusts, and custodial accounts when funded by parents (or grandparents, etc.). However, they may make sense (individual facts and circumstances need to be considered) for:
- The free $1,000 from the government for a child born in 2025-2028.
- A free $1,000 from an employer (link).
- Employee funding through a Section 125 (cafeteria) plan – see more below.
- A child who is close to age 18 – see more below.
Notes on that third option above:
- The plan cannot discriminate in favor of highly compensated employees.
- The $2,500 is total per employee, so if an employee has two children that would be just $1,250 each.
- There would be no basis in the account.
Assume a simple example of a 1099 independent contractor with a child under 18, no employees. The “employer” (the independent contractor themselves) can put $2,500 each year in the child’s Trump account. At 18 (ish, again see the full details here) the child could (and probably should for simplicity if nothing else) roll the balance to a traditional IRA. Then:
- A portion could be converted to a Roth IRA each year (keeping in mind the kiddie tax) while the child has no unearned income (and presumably trivial earned income), or
- The funds used for qualified education expenses or some other IRA distribution exception to the 10% penalty for early withdrawals.
Notes on the fourth option above (h/t Jason Lina for this one):
For a child turning 17 in a given year, a parent could presumably make a $5,000 contribution to the Trump account on December 31st of that year and then on January 1st, convert that $5,000 to a Roth IRA. This wouldn’t preclude any other Roth IRA contributions from any earned income and, if the conversion is done immediately, there shouldn’t be any tax ramifications. Essentially, it is equivalent to a $5,000 backdoor Roth contribution for the child without the need for earned income. It might even be worth contributing somewhat prior to 17 and taking the tax hit (if any) on the conversion to get the funds into a Roth.
Finally, note that if a parent, etc. makes a contribution to their child’s Trump account (not through a business), it appears that a form 709 (gift tax return) would have to be filed since, given the severe restrictions on the Trump account, that gift cannot use the gift of a present interest exception. Thus, the gift will use some of the donee’s lifetime estate and gift tax exemption. The work-around for this is for the parent to gift to the child and then have the child fund their own Trump account. A form 8606 must be filed each year the account exists as well to track the basis.
Twenty-Ninth, if you are interested in the distribution of household wealth, there is a great interactive tool to look at lots of data here. Note that there are two different dropdowns to look at various things.
Thirtieth, ten good rules for dealing with uncertainty here.
Thirty-First, new research (here) reinforces my decision to get virtually all of my information from reading.
Thirty-Second, recently some headlines said the market was down “significantly,” and I was asked if that was true. (This was intra-day on March 3rd, when it was down about 2% from the previous close.) Here was my response:
Using daily S&P 500 data from 1980 to today, the daily mean was 4 basis points, and the standard deviation was 112 bps. So, a one-standard deviation move down is 108 bps. Two standard deviations down would be 220 bps. Since two standard deviations include 95.4499736% of results (source), the percentage of times greater than that would be one minus that, or 4.55% (rounding slightly). Half of that would be the left tail. So, we would expect to have a daily loss of 220 bps on the S&P 500 2.275% of the time. There are 251 trading days a year so this should happen almost six times a year. Still, I would call a 2.2% move (or, even 2%) significant, but not rare.
By the close of the market, the loss had been trimmed to less than 1% though.
The flaw with the above calculations is that daily returns are not normally distributed. There is negative skewness and excess kurtosis (though much less if we eliminate October 19th, 1987). So, let’s look at the pure frequency of a 2.2% daily loss. I have 11,638 days the market was open (1/1/1980 to today) and 301 days had losses (on close) of 2.2% or more. That’s 301/11,638=2.59% of the days. So slightly higher (as expected) than when we assumed a normal distribution. With 251 trading days a year, we should expect about six and half days a year to have losses of 2.2% or more.
That doesn’t mean you should expect them to be one every two months or so, or every year to have six or so days like that. Volatility clusters!
Thirty-Third, some advice on fund selection here. Key point from the paper (IMHO):
The Sharpe ratio is almost perfectly aligned with investors’ welfare when borrowing is unrestricted. However, when borrowing is realistically restricted, this alignment breaks down dramatically. We show that the geometric mean (GM) provides a much better alternative for fund ranking in this case. Estimates of the ex-ante GM can be improved by first shrinking the sample gross GM and then subtracting fees. The generalized GM (GGM) captures this idea and provides a good estimate of the future net GM. We argue that mutual fund selection can be substantially improved by employing the GGM rather than the more popular Sharpe ratio or alpha.
Thirty-Fourth, Matt Levine is my favorite daily email. The first section of a recent note is basic, but I don’t know if everyone is aware of the dynamics at work in PC and PE. See this (alternate link).
Also, in the second paragraph he talks about a stylized saving/spending model. I did the math a long time ago on this, and the savings rate is much higher than you might think. See Savings Rates, Three Simple Formulas (first formula) and Four Rules for Guaranteed Financial Success (the second rule).
The third section is amusing (and exactly right) too: “People like to gamble on the results of random number generators.”
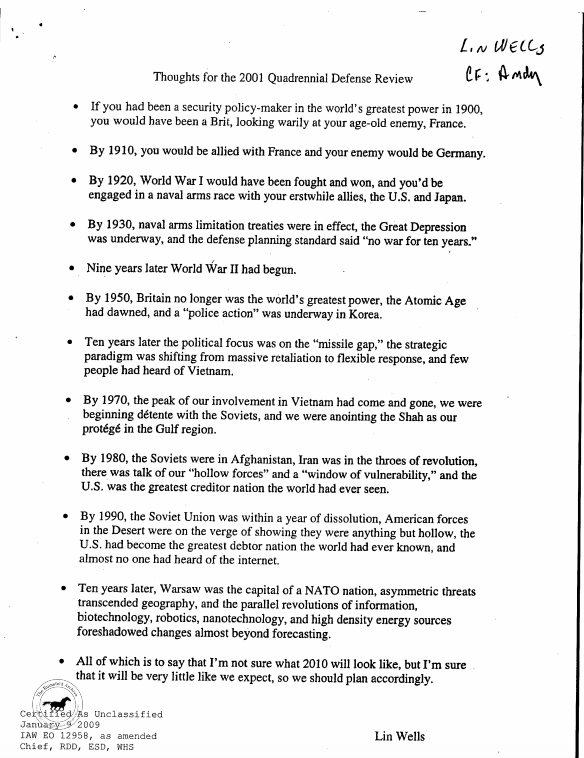
Thirty-Fifth, a memo (link), written by Lin Wells, was forwarded by Donald Rumsfeld to George Bush fils a few months before 9/11:
It demonstrates the difficulty (nay, futility) of prediction in the field of geopolitics, but I think it also applies to investment management.
Every generation is unprepared for the unpredictability of the future and are like the proverbial generals diligently preparing for the last (as in previous) war (link); not realizing (or at least not realizing fully) how different the next one will be.
That memo closes with excellent, though ironic, advice: “I’m sure [the future] will be very little like we expect, so we should plan accordingly.”
(See also Risk vs. Uncertainty.)
That closing line also reminds me of this WWII story (from Peter Bernstein’s Against the Gods):
One incident that occurred while [future Nobel Laureate Ken] Arrow was forecasting the weather illustrates both uncertainty and the human unwillingness to accept it. Some officers had been assigned the task of forecasting the weather a month ahead, but Arrow and his statisticians found that their long-range forecasts were no better than numbers pulled out of a hat. The forecasters agreed and asked their superiors to be relieved of this duty. The reply was: “The Commanding General is well aware that the forecasts are no good. However, he needs them for planning purposes.”
See also this for more along those same lines.
Thirty-Sixth, I did not know this nuance about depreciation errors on a tax return.
Thirty-Seventh, we’ve come much further than I think people recognize – 1913 wasn’t that long ago – but see this about some kids back then.
Thirty-Eighth, from Bubbles, Booms and Crashes in the US Stock Market 1792-2024:
Page 3: “We find that bubbles are extremely rare in the aggregate index as well as in industry indexes. Negative bubbles, in which a large decline is followed by a large gain, are slightly more frequent than positive bubbles… Booms do not predict crashes, but crashes are more frequent following booms. Comparison of conditional to unconditional distributions shows why this is so. Booming markets are more likely to be volatile markets in the subsequent period, with a higher likelihood of both large gains and losses.”
Page 8: “First, booms are more likely to be followed by further booms than by full reversals… Second, crashes are even more likely to be followed by recoveries than booms are to be followed by further booms…”
Page 19: “Large-scale booms and crashes have been relatively rare in US market history. Bubbles, defined as a boom followed by a crash, are by definition even rarer. Most important for investors is that the bubbles and crashes the US market experienced over more than two centuries of data have not been fatal to either the existence of the market, or to the fortunes of long-term investors.”
Page 20: “The industry-level analysis shows that booming (and crashing) industries are associated with subsequent high volatility, making both crashes and repeat booms more likely. However, once one controls for market trends, post-boom performance is not significantly different from unconditional returns. For crashing industries, rebounds are slightly more likely than further declines.”
Thirty-Ninth, in a recent client newsletter and blog post (here), I gave the traditional explanation of why assets are located where they are.
But I don’t think of it exactly that way. Here is what I consider a better explanation (though you generally get to the same conclusion).
There is no difference between an IRA and a Roth if you consider (as I think you should) the government to merely be a partner in the IRA. In other words, suppose a taxpayer will forever be in the 30% marginal bracket. In that case he or she simply owns 70% of the IRA, but for that portion it is completely tax-free and looks exactly like a Roth (except it has RMDs).
So, what we are really doing in asset location is deciding what goes into a taxable account and what goes into a tax-free account. The key is to determine which investments get the smallest return haircut when located in a taxable account. (That last sentence is the key so make sure you grok that before reading on.)
For example, assume someone is in the marginal 40.8% tax bracket (37% + 3.8%) for ordinary income and 23.8% (20% + 3.8%) for capital gains and qualified dividends (and living in a state with no income taxes, such as Florida or Texas). Further, let’s assume the investments are tax-efficient ETFs (so no capital gains distributions), and they will be held until death (so no sales). We’ll relax that last assumption later.
In keeping with the simple example in the newsletter, we’ll start with just two investments, VTI (stocks) and BND (bonds). According to Yahoo Finance, the yield on VTI is 1.11% and BND is 3.82%.
In a taxable account VTI will lose 1.11% * 23.8% = 26 bps, while BND will lose 3.82% * 40.8% = 156 bps. It is clearly much better to lose 26 bps rather than 156.
Let me add in VXUS so we have an international stock fund as well.
| ETF |
Yield |
Haircut |
| VTI |
1.11% |
0.26% |
| VXUS |
2.86% |
0.68% |
| BND |
3.82% |
1.56% |
In the above, I used the qualified dividend rate and ignored the foreign tax credit. If I adjust for both of those, the ranking now looks like this:
| ETF |
Yield |
Qualified Foreign Tax % of Dividends |
Taxable Yield |
Haircut |
| VTI |
1.11% |
0.00% |
1.11% |
0.26% |
| VXUS |
2.86% |
58.46% |
1.19% |
0.48% |
| BND |
3.82% |
0.00% |
3.82% |
1.56% |
I assumed the investments are held until a step-up at death. For bonds, I wouldn’t expect any capital gains, but for stocks, the higher the return and the shorter the time horizon until sale, the more tax inefficient the holding is. I made a quick table showing the annualized tax drag (the growth percentage is price only, not including the dividends since we took care of that above):
Annualized Growth% |
5 |
10 |
15 |
20 |
25 |
30 |
0% |
0.00% |
0.00% |
0.00% |
0.00% |
0.00% |
0.00% |
1% |
0.23% |
0.23% |
0.23% |
0.22% |
0.22% |
0.21% |
2% |
0.46% |
0.44% |
0.43% |
0.41% |
0.40% |
0.38% |
3% |
0.68% |
0.65% |
0.61% |
0.58% |
0.55% |
0.52% |
4% |
0.90% |
0.83% |
0.77% |
0.72% |
0.67% |
0.62% |
5% |
1.10% |
1.01% |
0.92% |
0.84% |
0.77% |
0.70% |
6% |
1.31% |
1.17% |
1.05% |
0.94% |
0.85% |
0.77% |
7% |
1.50% |
1.32% |
1.17% |
1.03% |
0.92% |
0.82% |
8% |
1.69% |
1.47% |
1.27% |
1.11% |
0.98% |
0.86% |
9% |
1.88% |
1.60% |
1.37% |
1.18% |
1.03% |
0.90% |
10% |
2.06% |
1.73% |
1.45% |
1.24% |
1.07% |
0.93% |
11% |
2.24% |
1.84% |
1.53% |
1.29% |
1.10% |
0.95% |
12% |
2.41% |
1.95% |
1.60% |
1.34% |
1.13% |
0.97% |
13% |
2.57% |
2.06% |
1.67% |
1.38% |
1.16% |
0.99% |
14% |
2.74% |
2.16% |
1.73% |
1.41% |
1.18% |
1.01% |
15% |
2.89% |
2.25% |
1.78% |
1.45% |
1.20% |
1.02% |
Let me give an example to show how to interpret this. Assume you expect a 5% return (remember this is price-only, so the total return would be that plus the dividend yield) and a ten-year holding period. I have made that cell bold above. You will lose 101 bps annualized, so we add that to the haircut on the dividends as we determined previously. So, for VTI, that would be 26 bps (dividends) plus 101 bps (growth) for a total of 127 bps. Compare that to BND at 156 bps (no growth), and it’s a closer call, but you still want stocks in the taxable account.
Notice that the higher the return, the worse having stocks in the taxable account is. This means (obviously) the converse is true as well: the worse stocks do the more you want them in the taxable account. As financial planners, what we should generally be trying to do is reduce the variance in the outcomes for the clients, i.e., accept worse good outcomes if it improves the poor outcomes sufficiently. This is why we diversify portfolios, buy insurance, etc. Locating the stocks portion of the allocation in the taxable account helps more when returns are poor – which is exactly when we most want them improved. (I wrote about this concept here: “The goal is to maximize the sum of happiness across all potential futures, keeping in mind the declining marginal utility of wealth.”)
You may wonder if the calculations change at lower tax rates, and the answer is, not really, since the LTCG/Qualified Dividend rates are always lower than OI rates.
Finally, let me close the loop on this by going back to having three buckets (IRA, Roth, and Taxable). First, you put stock funds that you are unlikely to turn over frequently or that you expect to have lower expected returns in the taxable account (to the extent that you can). Then you put everything else in the IRA/Roth accounts, but you prioritize between those two based on expected returns. In other words, because IRAs have RMDs you want the lower-expected-return funds to be in the IRA and the higher-expected-return funds in the Roth (again, after prioritizing putting the tax-efficient stock funds in the taxable account). This keeps more assets in tax-advantaged accounts longer. (If there were RMDs on Roths, or no RMDs on anything, then you would be indifferent to which assets are in each of those accounts. Note that the client has more exposure to assets in the Roth than the IRA though because, as noted above, in reality the government owns part of the IRA. I discussed that here.)
Fortieth, I thought I had sent something out on box-spread loans previously, but I can’t find anything. Anyway, there is a good introduction here. I hope this puts pressure on the rates Schwab, et al. charge for pledged asset line loans.
Forty-First, I have mentioned this before (link); we really should have a mortgage system like the Danes: A Danish Fix for U.S. Mortgage Lock-in?
Forty-Second, I assume everyone knows at least some of these Google search tools, but this is a good comprehensive list.
Forty-Third, a few college planning items:
- It appears that standardized test scores predict success at elite schools, while GPA predicts success at non-elite schools (source).
- Do graduate degrees pay off financially? It depends on the field. See details here.
Forty-Fourth, a newer advisor asked me for a good book on market history, and there are lots of them, but what they were looking for was something that would give all the little factoids and context that I spew. (The proximate reason for the request was they didn’t realize anything notable had happened in the market in 1987.) I don’t know of a book like that, so I thought I’d do a little potted history here of things that I sort of think it is important to know. This is idiosyncratic, U.S. centric, and focuses mainly on the 20th century.
1792 – NYSE founded by a group of traders who famously met under a buttonwood tree on Wall Street. (It was called Wall Street because it was originally the street that ran along the wall of the Dutch fort on the tip of New Amsterdam – now Manhattan.)
19th Century – frequent booms and busts and cycles of inflation and deflation (no net of either because of the gold standard). The economy is mostly agrarian, but there was a famous railroad bubble where investors lost a great deal of money – as they often do on exciting new technologies. This is a recurring historical cycle; investors lose on the new, new thing, but the thing gets built from all the capital thrown at it and life is better as consumers (rather than investors) win. Charles Dow creates the first stock index in 1884. It was a transportation index consisting of almost exclusively railroad stocks. In 1896 he created the Dow Jones Industrial Average by averaging the prices of 12 industrial stocks. I.e., adding up the prices and dividing by 12. The divisor has to be adjusted for corporate actions (splits, etc.) and for changes in the components (which have different prices) so it is currently 0.16242563904928. This is a very dumb way to create an index but there wasn’t anything better at the time. The number of components was increased to 30 in 1928. When both the industrial and transportation indexes went in the same direction it was considered a broad-based market move. (This was part of Dow Theory.)
1900s – No federal reserve yet, and there is a market crash and run on banks and trust companies (which functioned as banks back then) in 1907. J.P. Morgan steps in and essentially acts as a central banker. Subsequently people thought that maybe the life or death of the economy shouldn’t be dependent on one private citizen’s rectitude and responsibility and a proper Federal Reserve Bank should be established.
1910s – WWI breaks out and the widespread sales of war bonds (“Liberty Bonds”) introduced the masses to investing. Before that, the Federal reserve was created in 1913, and the 16th amendment was passed that year as well. This permitted income taxes to be levied. As with most taxes, it was pitched as (obviously) having a low rate and apply only to rich people: 1% on incomes over $3,000 and a 7% on incomes over $500,000. Those are equivalent to about $100,000 and $16.5 million today. Alas, it didn’t last (it never does), and the 1916 Revenue Act and the War Revenue Act of 1917 increased the highest rates to 77% by 1918. In 1914 the stock market was completely closed for over four months due to WWI and was only partially reopened for an additional four months.
1920s – After a shaky start to the decade (severe deflation, unemployment, and economic contraction) a bull market boom began, and the “roaring twenties” was in full swing. Tech stocks such as automobiles, airplanes, and “Radio” (RCA) were the cat’s pajamas/bee’s knees (silly slang is not a modern phenomena). Margin requirements were just 5-10% in many cases. Smaller investors frequented “bucket shops” which took bets on stocks but didn’t actually invest any money in them (though customers may have thought they were investing). “Wirehouses” were more reputable companies that were large enough to have lines (wires) to the exchanges so they could place actual trades. Irving Fisher (an enormously respected economist) famously says in 1929 (nine days before the crash) that stocks had reached “a permanently high plateau.” The crash occurred on Black Tuesday, October 29th, 1929. Fee-only investment advisors were called “investment counselors” to differentiate them from tipsters, touts, and customer’s men (i.e., stock brokers). (In previous centuries brokers were called “stock jobbers” as well.)
1930s – The Great Depression ensued. There was deflation so stocks did a little better in real dollars versus nominal dollars, but still, using monthly nominal dollars for the S&P 500 and 5-yr Treasurys, in May 1932, a 60/40 portfolio was 62.1% off the August 1929 all-time high, and in March 1938, a 60/40 portfolio was 32.0% off the February 1937 all-time high. That new high in 1937 was fleeting so it didn’t seem like a recovery from 1929 yet. An investor in stocks in August 1929 did not recover (in real dollars with dividends reinvested) permanently for over 15 years (January of 1945). Ben Graham (the father of value investing) was buying “cigar butts” (stocks with assets greater than their prices – terrible companies maybe, but there might be one or two more puffs left in them). He (with others) founded the New York Society of Security Analysts in 1937 to professionalize investing.
1940s – After the war, people expected the Great Depression to resume – it did not, but an entire generation vowed to never buy stocks again. Milton Friedman, then a young government staffer, ironically was instrumental in implementing a new idea called “withholding” for taxes. (He later apologized. Imagine how much lower income taxes would be if everyone had to write a check for the entire amount at once each April.) Wages and prices are frozen during the war, so companies began to offer non-taxable fringe benefits such as health insurance to get around the restrictions, which, of course, created the third-party-payer problems we still contend with.
1950s – The S&P 500 index is created on March 4th, 1957. It was appended to an earlier index that had 90 stocks, so you often see data back to 1926 labeled “S&P 500,” but, strictly speaking, it isn’t.
1960s – This was the go-go years where growth stocks were ascendant. It was also the era of slapping “tronics” onto the end of a company name to get a stock pop (much as was done with “.com” thirty years later – there’s really nothing new in markets). It was also the era of “professional” management who thought that any company in any industry could be run by scientific principles, so conglomerates bought companies as subsidiaries which had no synergies or logic whatsoever. (This was all unwound in the 1980s with LBOs, spinoffs, and takeovers.) The “nifty-fifty” were fifty stocks considered so blue chip that the price didn’t matter. They were “one-decision” stocks, you only had to decide to buy them, because you would never sell them. Nonetheless (or more likely, due to this), a stock investor in November 1968 didn’t see their investment increase in real dollars with dividends reinvested until March of 1983 – over 14 years later. It turns out that it very much does matter what you pay for an investment. Merrill Lynch donated $50,000 to the University of Chicago to found the Center for Research in Security Prices (CRSP). For the first time someone would determine what the return on stocks had been (and that active managers almost universally failed to achieve that return). The first CFA examination occurred in 1963. The psychologically meaningful DJIA hit 995.15 on February 9th, 1966; but didn’t permanently cross 1,000 until November 1982 after the election of Ronald Reagan. There was a “paperwork crisis” as the bull market volumes (and manual processes) created issues. The market started closing early to deal with it and then closed completely on Wednesdays in the latter half of 1968.
1970s – The United States goes fully off of the gold standard so now persistent inflation exists (though this is almost certainly better than the alternative). Stock commissions are deregulated on May 1st, 1975 and brokerage firms are scared, but Charles Schwab decided to lean into the pricing flexibility and compete on price – a novel concept. The rates banks could pay on savings was capped by law (and below inflation) so money market funds were created to work around this. Merrill Lynch created NOW (Negotiable Order of Withdrawal) accounts which gave investors checkbooks that they could use to access their funds. Most of their competitors thought this innovation was insanity as you weren’t supposed to let people easily take funds out of their accounts, but it turns out if they know they can take it out, they will put more in in the first place. The Chicago Board Options Exchange (CBOE) launched with the first listed options. Standardized contract sizes, strike prices, and expiration dates, created a liquid secondary market. The first broad-based index fund available to retail investors was launched by John Bogle at Vanguard on December 31st, 1975. (It was nicknamed Bogle’s Folly – after all, who would want “guaranteed mediocrity?” Today it has about $1.5 trillion in assets.)
1980s – The 1986 tax act is an enormous simplification and lowering of tax rates with a top rate of 28% on a much broader base. There is a huge Japanese stock market bubble in the latter half of this decade. It took until 2024 for the Nikkei to reach the 38,915.87 it first reached in 1989. There was a massive stock market crash on Black Monday, October 19th, 1987 when the DJIA dropped 22.6% (though the year as a whole had a perfectly normal total return of 5.25%). Tickers were running over an hour behind; meaning investors sold in a panic without knowing what prices even were and then didn’t know if their trades were even executed. See here for more.
1990s – Stock settlement was T+5 until 1993 when it went to T+3 (it went to T+2 in 2017, then T+1 in 2024). TIPS, Roths, and lower long-term capital gains tax rates were all introduced in 1997. (In the case of capital gains rates, I should really say “re-introduced.” From 1942-1978 taxpayers could exclude 50% of capital gains on assets held for at least six months.) The “dot com” boom was huge. The stock market (S&P 500) returned 34.11% in 1995 and 20.26% in 1996 and Alan Greenspan gives his famous “Irrational Exuberance” speech in December of that year. Nonetheless stocks go on to return 31.01% (1997); 26.67% (1998); and 19.53% (1999).
Early 2000s – The S&P 500 goes down 10.14% in 2000 and a further 13.04% in 2001, but “everyone knows” it has never gone down three years in a row so that simply can’t happen. Of course, it returns -23.37% in 2002. As I frequently point out, the historical worst-case scenario was not the worst historical case just prior to it occurring. Financial instruments were quoted in eights (stocks until 1997), or ‘steenths/teenies (sixteenths) until “decimalization” in 2001 which reduced spreads enormously. The 2001 tax act (EGTRRA) and the follow-on 2003 tax act (JGTRRA) dramatically lowered income tax and estate tax rates, as well as significantly expanding and simplifying IRA and qualified plan options.
I’m going to stop there – before the GFC. I assume most people know more recent history.
For books that offer a broad sweep of market history I recommend Manias, Panics, and Crashes: A History of Financial Crises by Charles Kindleberger or Devil Take the Hindmost: A History of Financial Speculation by Edward Chancellor.
For more targeted reading, a great place to start is the Wiley Investment Classics series. I’d read them by publication date; they did the better ones first. Here is a list sorted that way.
Finally, I recommend Against the Gods: The Remarkable Story of Risk by Peter Bernstein (also mentioned above).
Forty-Fifth, the following are on our website (here), and the ones in bold have been updated recently:
White Papers
Charts
Spreadsheets
Finally, my recurring reminder that J.P. Morgan’s updated Guide to the Markets for this quarter is out and filled with great data as usual.
That’s it for this quarter. I hope some of the above was beneficial.
If you are receiving this email directly from me, you are on my list of Financial Professionals who have requested I share things that may be of interest. If you no longer wish to be on this list or have an associate who would like to be on the list, simply let me know.
We have clients nationwide; if you ever have an opportunity to send a potential client our way that would be greatly appreciated. We also have been hired by some of our fellow advisors as consultants to help where we can with their businesses. If you are interested in learning more about that arrangement, please let us know.
We also offer a monthly email newsletter, Financial Foundations, which is intended more for private clients. If you would like to be on that list as well, you may edit your preferences here.
Finally, if you have a colleague who would like to subscribe to this list, they may do so from that link as well.
Regards,
David
Disclosure
|